
How Homora V2 Simplifies the UX for Farming on Uniswap V3

Uniswap V3 has been considered the most advanced form of AMM yet, allowing users to select arbitrary price ranges on their positions and increase their capital efficiency even further. One of our aims for the Optimism launch, integrating with Uniswap V3 is so users can utilize the cheaper, faster transactions on L2 while enjoying the full capital efficiencies unlocked through Uniswap V3.
However, in exchange for capital efficiency, this extra feature creates more complexity for the users to specify a farming price range from infinitely possible combinations.
To simplify things for our users, one of the new key features for this launch is the 3 recommended price ranges (Wide, Medium, and Narrow) that users can choose from when opening a position on Uniswap V3 pools. The recommended price ranges resulted from identifying optimal provided price ratios based on historical analyses done by our research team. We’ll discuss the rationale and thought process behind the selected parameters in the rest of this article.
Terminology
Before we dive into the analysis, here are some of the key terms used.
The Analysis
Before coming up with the optimal price ratios (PPRs), we simulated Homora V2 farming strategies on the given historical data using different values of PPRs, farming durations, leverages, and borrow ratios. The results of strategies using different PPRs are compared based on the following evaluation metrics:
- Average PnL
- PnL Volatility
- Debt Ratio
- Sharpe Ratio
Evaluation Metrics Used
1. Average PnL
PnL is the percentage change in dollar values from farming via Homora V2 w.r.t. simply holding the assets. The higher the PnLs, the better.
However, depending on the market conditions (e.g. bull/bear), farming at different times can yield very different PnL results. Therefore, the Average PnL across multiple farming timeframes is used to better represent the expected return.
2. PnL Volatility
PnL volatility is the standard deviation of the farmed PnLs across different times. The higher the volatility, the more uncertainty the farming period will yield the desired results. So, when comparing strategies with the same or similar PnL, the strategy with lower volatility would better capture certainty and predictability.
3. Debt Ratio
Debt ratio, valued from 0% to 100%, indicates how close farming positions are susceptible to liquidation. To gauge if a position is risky when farming on Homora V2, a position’s maximum debt ratio over the farming duration is measured. The closer the max debt ratio is to 100%, the riskier a position is during the farming period.
4. Sharpe Ratio
Sharpe ratio, or the risk-adjusted return of a position, is used to compare PnLs with respect to the risks. It is calculated using the averaged farming PnL divided by PnL volatility. Higher Sharpe ratio represents an expected outcome with a potentially higher return with fewer risks, so the better in our case as an indicator.
Running the Backtest Simulation
We ran the backtest simulation using Uniswap V3's historical data of 1 year from June 2021 to June 2022. We conducted all the parameters combinations below:
- Farming durations (weeks) : [1, 2, 4, 8, 12]
- Leverage : [1, 1.5, 2, 2.5, 3]
- Borrow ratio : [0%, 50%, 100%]
For each parameter combination (e.g. duration = 4 weeks, leverage = 2x, and borrow ratio = 50%), we compared the result based on our evaluation metrics on different values of PPRs – 1.1, 1.2, 1.3, 1.5, 2, 3, and 4.
Results
For the results below, we have compiled the most relevant information to highlight the key findings from the process. For each parameter configuration, we compare the results from different PPRs to identify the optimal PPRs based on our evaluation metrics.
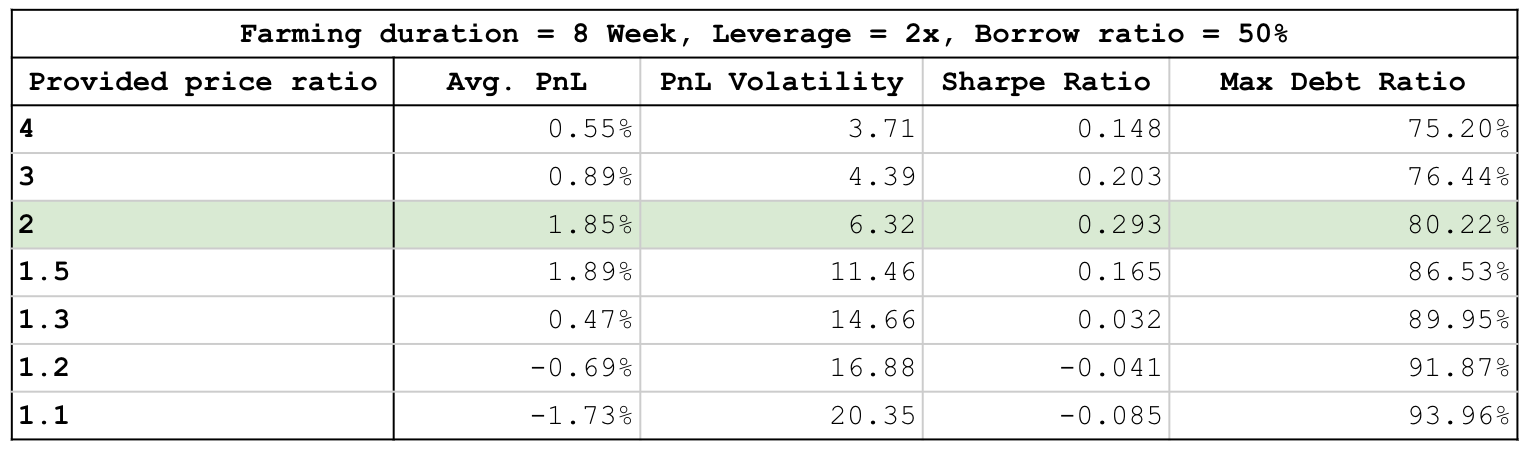
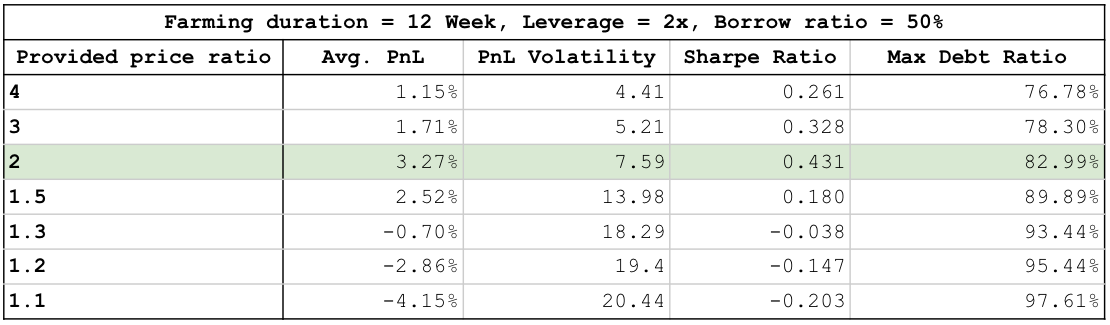
In long-duration farming (up to 12 weeks), our data show that a PPR of 2 outperforms other PPR values, having the highest average PnL and Sharpe ratio while maintaining the max debt ratio in the safe threshold as shown in Table 1 and Table 2.
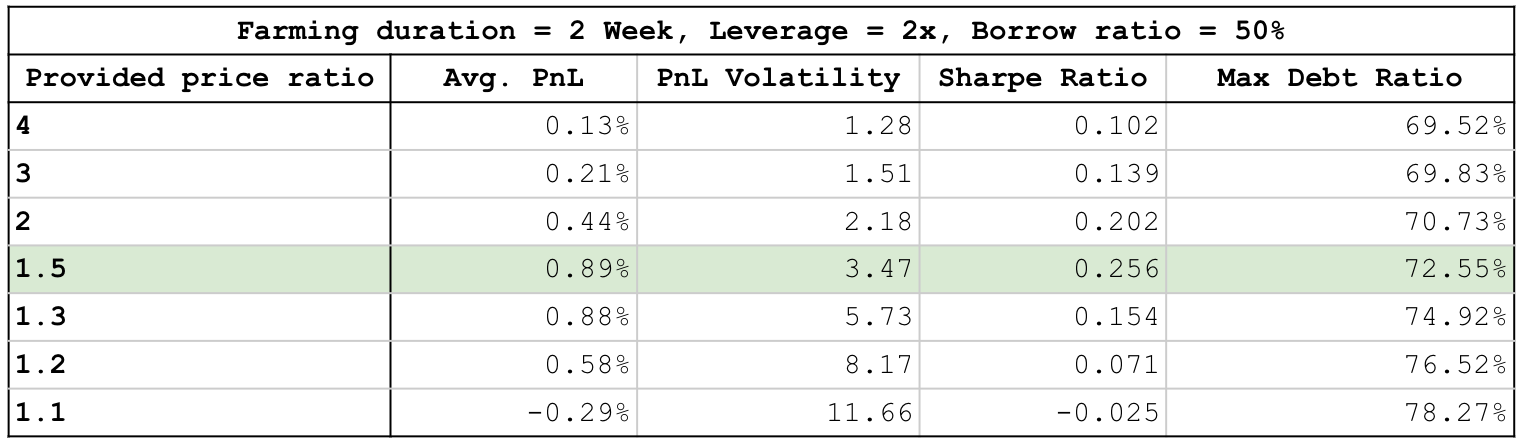
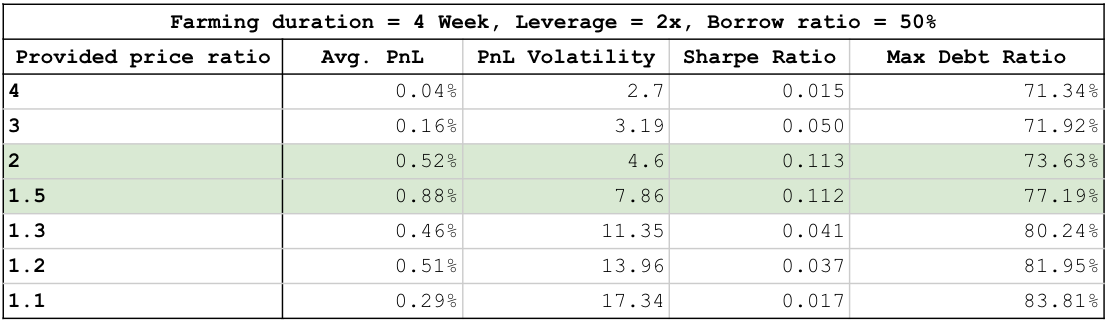
Meanwhile, the optimal PPRs for medium farming durations (2 or 4 weeks) result in 1.5 and 2 as seen in Table 3 and Table 4.
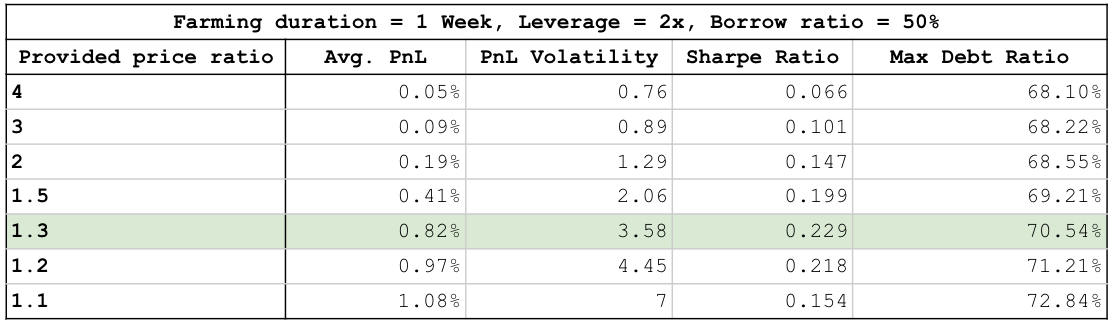
Lastly, short farming durations (1 week) are more suitable for lower PPR values. As shown in Table 5 illustrating the results using the leverage of 2x and borrow ratio of 50%, the optimal PPR points to 1.3.
Additional data points reinforcing the same results are displayed in the Appendix, using other leverages and borrow ratio values.
Conclusion
We conducted a backtest experiment on the profitability of positions of Uniswap V3 on Homora V2 based on our evaluation metrics: Average PnLs, PnL volatility, Debt ratios, and Sharpe ratios. We select 3 optimal values of PPRs for leverage yield farming to be 1.3, 1.5, and 2 to suit our users' farming behaviors, whether they want to open short or long-duration positions.
In short,
Narrow range (PPR = 1.3) is most suitable for short farming duration i.e. 1-2 weeks
Medium range (PPR = 1.5) is most suitable for medium farming duration i.e. 2-8 weeks
Wide range (PPR = 2) is most suitable for long farming duration i.e. 8-12 weeks
Appendix
As the entire simulation generated a large amount of data and scenarios, we have decided to only pick a few to illustrate our process.
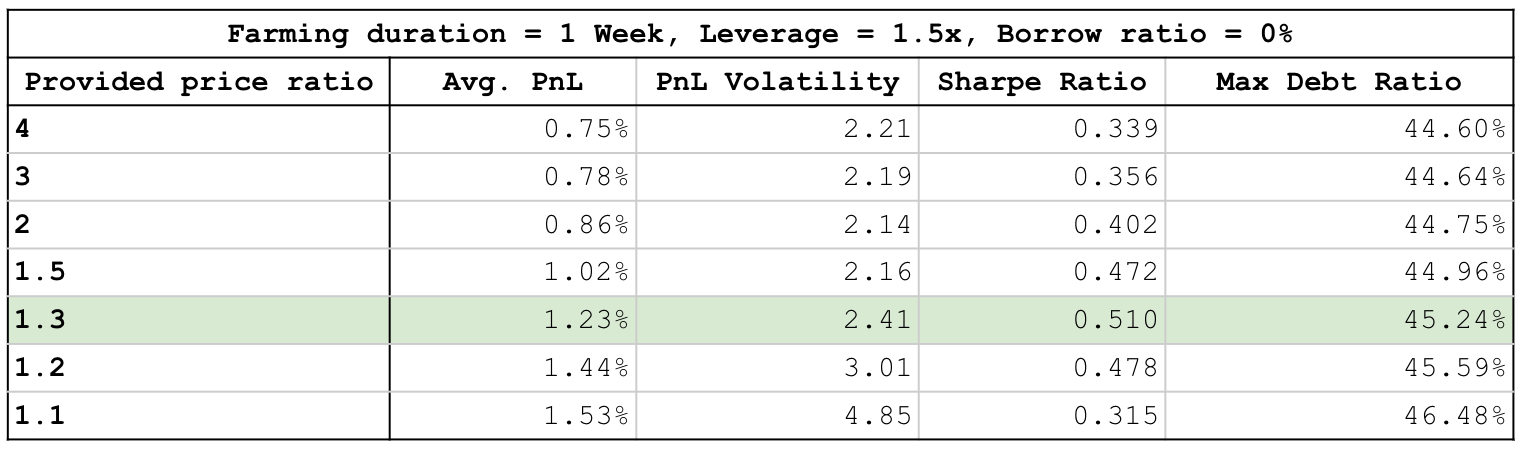
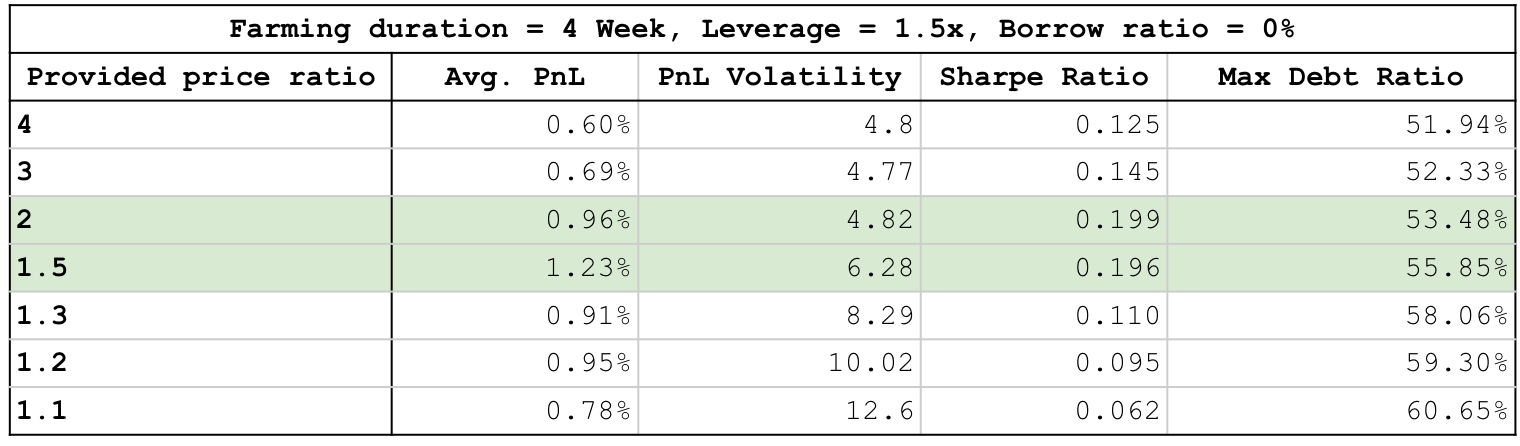
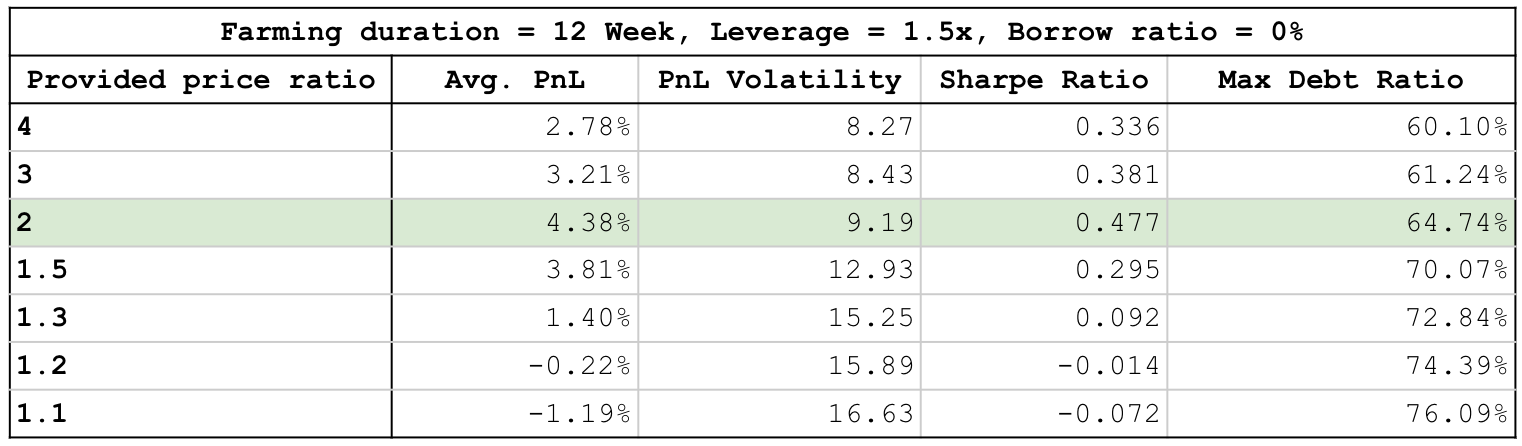
Here are some additional examples of farming strategies from other configuration settings which also followed closely with our findings above for the optimal PPR values of 2, 1.5, and 1.3 for each range of farming durations.
Below are more examples of another configuration with leverage = 1.5x and borrow ratio = 0% on different farming durations (1, 4, and 12 weeks).
About Alpha Venture DAO (Previously Alpha Finance Lab)
A Builders’ DAO. We explore and innovate at the fringes of Web3 and drive significant value to Web3 users, and ultimately, alpha returns to the Alpha community.
Join our Telegram/Discord for the latest updates, follow us on Twitter, or read more about us on our Blog and Document!


